Tanker rates: a window into global oil market disruptions
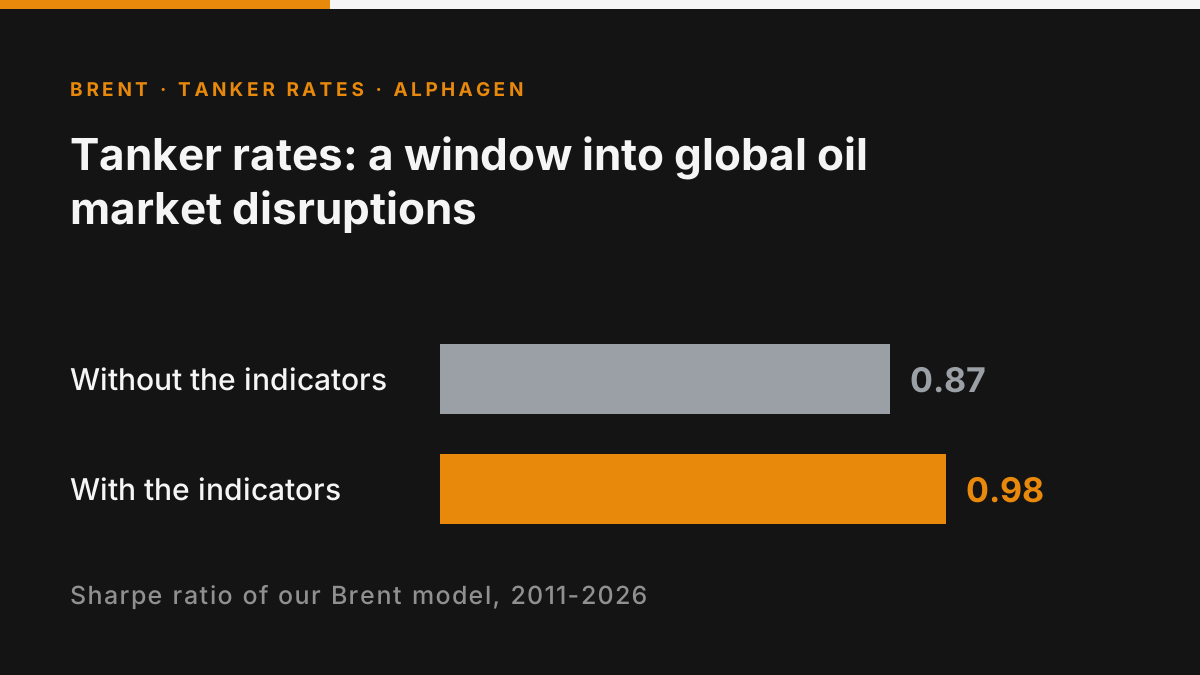
Tanker rates may be the most direct market signal of disruptions in the physical delivery of oil. On their own, AlphaGen's strategies on them lost money on Brent from October 2018; with them, dry freight and the dollar added, our Brent model did better, mostly in 2026.
Commodity Signal Review · 5 October 2026 · Geneva
Tanker rates may be the most direct market signal of disruptions in the physical delivery of oil. On their own, AlphaGen's strategies on them lost money on Brent from October 2018; with them, dry freight and the dollar added, our Brent model did better, mostly in 2026.
A VLCC1 is the largest crude tanker. Rates to hire one for a voyage at once2 reached a record $1.27 million a day on 21 September, Oilprice.com reported, as transfer capacity off Oman maxed out3. ICE Brent for December delivery rose $6.15 a barrel between 29 September and 1 October, to $102.31. AlphaGen, our modelling tool, measured what tanker rates, dry-cargo freight and the dollar told a Brent trader about the next session's price.
The essentials
- Tanker rates react to oil-market disruptions, from US sanctions on COSCO in 2019 and the 2020 glut that filled tankers with stored oil to the Hormuz closures of 2026; a 2024 study found oil moving first and tanker rates following.
- On their own, strategies on tanker rates lost money on Brent from October 2018, on the rate (Sharpe ratio −0.53) and on its 20-session change (−0.34); they lost most in 2020, as crude fell, and made money in 2026.
- With tanker rates, dry freight and the dollar added, our Brent model's Sharpe ratio over 2011-2026 rose from 0.87 to 0.98, from 0.89 to 0.93 over 2011-2025 and from 0.53 to 1.90 in 2026 to 1 October; adding them also reweighted its other variables.
- The curve shows whether a disruption leaves prompt supply short: December, which expires on 30 October, stood $3.88 a barrel over January on 1 October 2026.
What the research says about freight, the dollar and oil
Studies of tankers and crude find the oil price moving first. Pouliasis and Bentsos compared weekly Brent and WTI returns with the Baltic Exchange's index of crude tanker rates, the Dirty Tanker Index, from 2000 to 2020: oil helped predict tanker rates, and tanker rates did not help predict oil4. The two moved apart when oil was volatile and slightly together when it was calm. An earlier study tied tanker rates to oil prices and US crude stocks5. Kilian left crude tanker rates out of his gauge of world demand, because attacks in the Persian Gulf raise them6.
Dry-cargo freight is a different case. Ships carrying iron ore, coal and grain are hired when factories and builders need raw materials, so their rates follow world demand. Kilian built a demand gauge from those rates and found, in monthly data from 1973 to 2005, that a rise in demand lifted the real price of oil, with an effect that became clear only after six months and then lasted6. Hamilton tested a later version of the gauge on monthly data from 1968 to 2018 and found it told little about where commodity prices, crude among them, went next7.
Oil is priced in dollars, so a weaker dollar makes a barrel cheaper for buyers paying in euros or yuan. A European Central Bank study of daily data from 2001 to 2012 found that a 1% fall in the dollar raised oil prices by 0.73%, and that the link ran both ways8. A Norges Bank study found the same direction over quarters, from 1990 to 20079. Apart from the ECB's, these studies use weekly, monthly or quarterly data. AlphaGen's tests judge the next session: they check the sign of each link over one day, and leave aside Kilian's slow demand effect and which market moves first.
Strategies on tanker rates alone lost money on Brent; our Brent model did better with all three indicators
AlphaGen builds for each product a strategy that goes long or short each day from the variables it is given, recalibrates it on past data only, and measures what the strategy would have gained or lost. Each position uses only data known the session before, so every result from 2011 comes from data the model had not seen. The Sharpe ratio scores each strategy as its annual gain relative to the risk taken: positive, it made money; negative, it lost.
The first test used each indicator alone, as a level and as its change over 20 sessions, about a month. The strategies on dry freight and the dollar took the research's signs: dearer dry freight for a higher Brent, a stronger dollar for a lower one. Tanker rates took the sign we drew from this month's reports, which tied the record rates to disrupted Gulf supply, from Hormuz closures to full transfer capacity off Oman103: dearer tankers for a higher Brent. Neither report says that freight lifts Brent, and none of the studies supports that sign. From October 2018, when they first took positions, strategies on tanker rates lost money on the rate (Sharpe ratio −0.53) and on its change (−0.34); over 2019-2026 they scored −0.31 and −0.27.
Tanker rates rise when shipping is disrupted and when unsold oil goes to sea, whichever way Brent moves, so a strategy that buys Brent on dearer tankers can hold the wrong side. In October 2019, rates jumped on US sanctions against the Chinese shipping firm COSCO, a disruption in shipping rather than in crude supply11. In spring 2020 traders hired tankers to store oil that tanks ashore could not hold, and rates soared as crude fell12. 2020 was the strategies' worst full year, on the rate (−2.51) and on its change (−1.97). They made money in 2026 up to 1 October (0.37 and 1.98), the year of the Gulf disruption10.
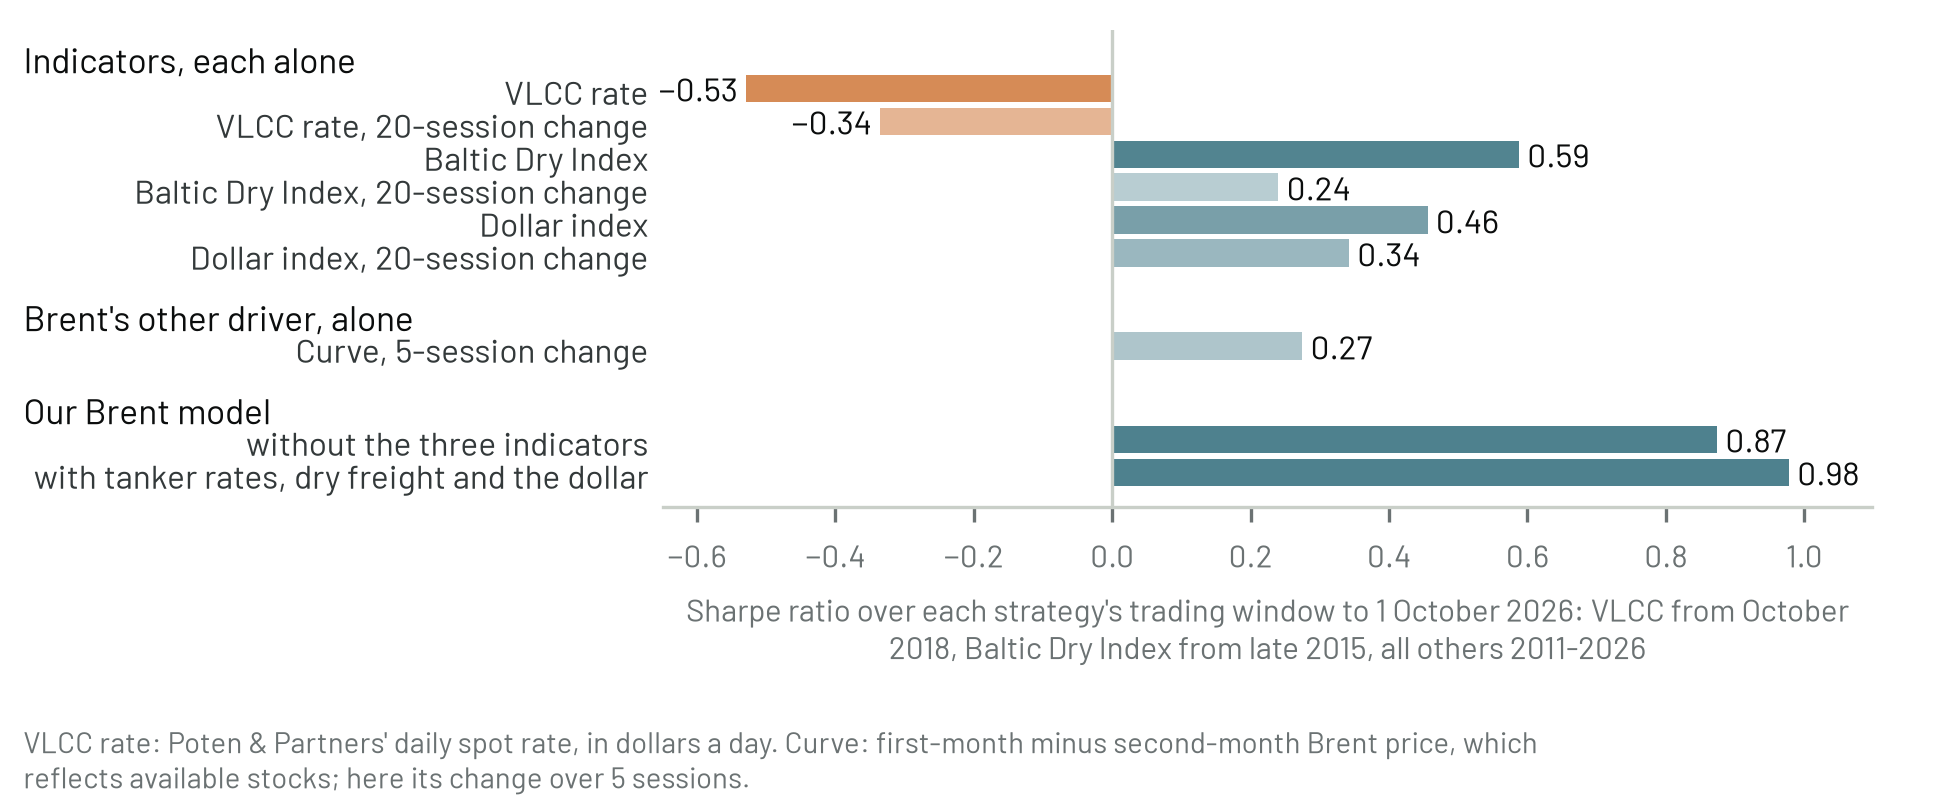
Sharpe ratio of the positions AlphaGen took on ICE Brent up to 1 October 2026, judged on sessions after each calibration, over each strategy's trading window from its first position. Each input enters at its previous-session value. Sources: ICE Futures Europe (Brent), Poten & Partners (VLCC rate), Baltic Exchange (Baltic Dry Index), ICE Futures U.S. (dollar index); the model also uses data from the EIA, Baker Hughes, CME Group, Cboe, MSCI, OPEC and the Caldara-Iacoviello geopolitical risk index. Last observation: 1 October 2026.
Strategies on dry freight made money, on the index over 2016-2026 (0.59) and on its change from October 2015 (0.24). The change gained in 2015-2018 (0.83) and lost in 2019-2026 (−0.03). Strategies on the dollar made money over 2011-2026, on the index (0.46) and on its change (0.34). Most of it came in 2011-2018 (0.77 and 0.66); over 2019-2026 they scored 0.13 and 0.01.
Among Brent's other drivers, each tested alone, the futures curve made money. It moves into backwardation, the nearest month above the next, when stocks are low13. A strategy on its change over five sessions, the definition our Brent model uses, scored 0.27 over 2011-2026: 0.61 in 2011-2018 and −0.04 in 2019-2026. A strategy on the American Petroleum Institute's weekly US crude stocks lost money from April 2016 (−0.59).
In the third test, AlphaGen calibrated our Brent model14, 12 variables from US output, rig counts and refining margins to China's factory survey and the futures curve, first without its own tanker-rate and dollar inputs, then with tanker rates, dry freight and the dollar added. Over 2011-2026 it scored 0.87 without them and 0.98 with them (chart above). At the last calibration the three took 23% of the model's weights.
The gain is uneven: the model did better with the indicators in eight of the 16 calendar years. In 2026, the year of the Hormuz closures10, it scored 1.90 with them against 0.53 without, up to 1 October; over 2011-2025, 0.93 against 0.89. Its largest gains came in 2014, 2021 and 2026, and in each of those years one indicator's own strategy made money. In 2014 the dollar rose while oil collapsed; the World Bank counts the stronger dollar among the causes, since it weakens oil demand outside the United States15, and the dollar strategy scored 3.57 that year. In 2021 dry-bulk rates climbed on iron-ore shipments and port congestion in China16, and the dry-freight strategy scored 1.49. In 2026 the strategies on tanker rates made money. Adding the three indicators, six inputs in all, also changed the weights of the other variables, so the difference is not their information alone, and each result is a single run.
What to watch in October
Record tanker rates mark disruption in the oil market, from closed straits to unsold oil stored at sea, but not which way Brent goes next. On these tests, this month's tanker rates are no reason on their own to open, add to or time a Brent position.
Whether a disruption leaves prompt supply short shows in the curve, which moves into backwardation when stocks are low and narrows when they rebuild13. December Brent expires on 30 October, when January becomes the nearest month; on 1 October 2026 December stood $3.88 a barrel over January.
How we know
Tanker rates are Poten & Partners' daily VLCC spot assessment, from 2018; dry freight is the Baltic Dry Index, from 2015; the dollar is ICE Futures U.S.'s dollar index, from 2009. Each is held back one session, because its publication time against Brent's close is not certain. The signs of dry freight and the dollar come from the research and were set before any run; tanker rates took a sign we drew from this month's press reports on Gulf disruption, which neither those reports nor the research state. Our model's own tanker-rate and dollar inputs were left out of both versions; the second added the three indicators in the forms of the first test. AlphaGen's second test: drivers picked from inputs already tested, for their mechanism and for how they did, then recalibrated alone. The three indicators were not selected. The curve's first-to-second-month level was set aside because AlphaGen's positions on it followed Brent's own trend.
How this issue was built
Improm Atlas gathered the market record, and AlphaGen measured, on data it had not seen, how well each indicator anticipated each market. Talk to us about testing your own indicators.
atlas.improm.ai · alphagen.improm.ai · improm.ai
Note — Not investment advice.
Footnotes
-
VLCC, very large crude carrier: the trade's name for the largest class of crude tanker. ↩
-
Spot rate: the price of hiring a tanker for a voyage now, quoted in dollars a day. ↩
-
Irina Slav, Oilprice.com, 25 September 2026. VLCC Rates Hit Record $1.27 Million a Day as Oman Transfer Capacity Maxes Out ↩ ↩2
-
Panos K. Pouliasis and Christos Bentsos, International Journal of Finance and Economics 29(2), 2024. Oil price uncertainty and the relation to tanker shipping ↩
-
Angela Poulakidas and Fred Joutz, Maritime Policy & Management 36(3), 2009. Exploring the link between oil prices and tanker rates ↩
-
Lutz Kilian, American Economic Review 99(3), June 2009. Not All Oil Price Shocks Are Alike: Disentangling Demand and Supply Shocks in the Crude Oil Market ↩ ↩2
-
James D. Hamilton, Journal of Applied Econometrics 36(3), 2021. Measuring Global Economic Activity ↩
-
Marcel Fratzscher, Daniel Schneider and Ine Van Robays, European Central Bank Working Paper 1689, July 2014. Oil Prices, Exchange Rates and Asset Pricesecbwp1689.pdf ↩
-
Q. Farooq Akram, Energy Economics 31(6), November 2009. Commodity prices, interest rates and the dollar ↩
-
Irina Slav, Oilprice.com, 24 September 2026. Brent Holds Above $102 as Iran Talks Stall Over Hormuz Conditions ↩ ↩2 ↩3
-
U.S. Energy Information Administration, 21 October 2020. This Week in Petroleum: tanker rates ↩
-
U.S. Energy Information Administration, 28 October 2020. Crude oil tanker rates are likely to remain low until global petroleum demand increases ↩
-
Gary Gorton, Fumio Hayashi and K. Geert Rouwenhorst, NBER Working Paper 13249, July 2007. The Fundamentals of Commodity Futures Returnsw13249.pdf ↩ ↩2
-
Our Brent model: the variables and signs we use every day to follow Brent, rebuilt from the raw series. ↩
-
John Baffes, M. Ayhan Kose, Franziska Ohnsorge and Marc Stocker, World Bank Policy Research Note PRN/15/01, March 2015. The Great Plunge in Oil Prices: Causes, Consequences, and Policy Responses94725-NWP-PRN01-Mar2015-Oil-Prices-Box393265B-PUBLIC.pdf ↩
-
gCaptain, relaying Reuters, 29 September 2021. Baltic Dry Index Cracks 5,000 Points for First Time Since 2007-2008 Super Cycle ↩
Continue reading
Should cocoa traders follow El Niño?
· 7 min
The best way to trade the oil shock is a sugar contract
· 3 min
Test your own variable on your own data
AlphaGen runs the statistical battery, the calibration and the risk-managed backtest for you — in minutes, not weeks.