What USDA's October report changed in the figures our models read
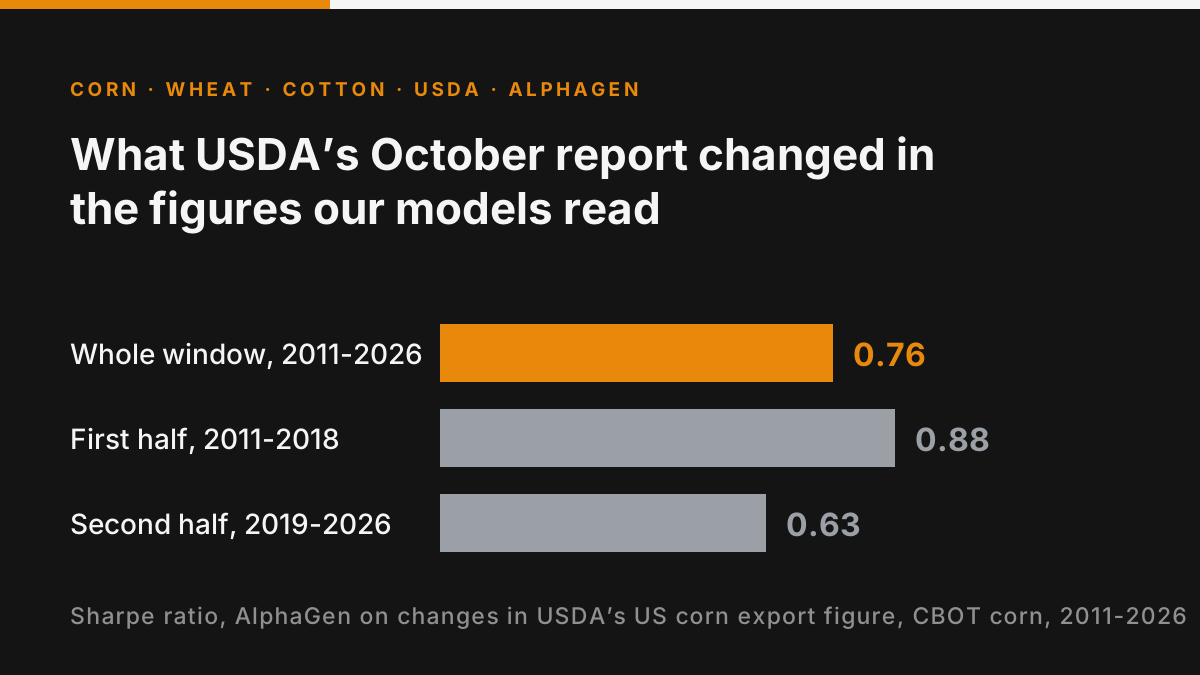
On 9 October, USDA raised its US corn export forecast and deepened the fall it expects in world wheat stocks, two figures our models read; it left cotton exports unchanged. AlphaGen's strategy on the corn export changes, tested alone, made money over 2011-2018 and 2019-2026.
Commodity Signal Review · 12 October 2026 · Geneva
On 9 October, USDA raised its US corn export forecast and deepened the fall it expects in world wheat stocks, two figures our models read; it left cotton exports unchanged. AlphaGen's strategy on the corn export changes, tested alone, made money over 2011-2018 and 2019-2026.
USDA's monthly supply and demand report of 9 October found more US corn than its September report did. The yield went up, and so did the grain carried in from last season1. CBOT December corn closed 20.50 cents lower that day, at 479.75 cents a bushel. Wheat exports were cut and cotton's crop was raised, yet ICE December cotton closed higher. Research on these reports finds that futures take in the news within minutes2. AlphaGen, our modelling tool, measured what the balance-sheet lines our models read told a trader about the sessions that follow.
The essentials
- USDA now sees 1,849 million bushels of US corn left next August, 282 million more than in September. December corn fell 4.1% on 9 October.
- USDA cut US wheat exports to 750 million bushels and raised the cotton crop to 13.44 million bales; December cotton still rose 0.60 cent.
- Tested alone, AlphaGen's strategy on changes in USDA's US corn export figure scored a Sharpe ratio of 0.76 from January 2011 to 9 October 2026.
- USDA's next report is due on 10 November at noon New York time; AlphaGen's strategies take in its figures at that day's close, one of them a session later.
What USDA changed, and what the research says
Of the three crops, corn's ending stocks moved most in USDA's October report3. USDA's balance sheet for a crop sets supply, the stocks carried in plus the harvest and imports, against use. For the 2026/27 marketing year, September to August for corn, it put US ending stocks4 at 1,849 million bushels, up from 1,567 million in September1. Most of the rise came from two revisions. The yield rose from 178.5 to 181.2 bushels an acre, which took the crop to 16,034 million bushels. Stocks carried in from last season rose 173 million bushels after USDA's quarterly Grain Stocks count. USDA raised exports too, but by less than supply.
CBOT December corn closed at 479.75 cents a bushel on 9 October, down 20.50 cents or 4.1% from 8 October. The report came out during the trading session.
Wheat's change came from trade. USDA cut US exports from 775 to 750 million bushels, led by hard red winter, the Plains bread wheat, which it called "uncompetitive in export markets" at prices well above last year's. Ending stocks rose from 717 to 740 million bushels. World trade was cut from 211.8 to 209.0 million tonnes, with Russia's exports the lowest in five years1. Euronext December milling wheat settled 2.25 euros lower, at 242.00 euros a tonne5.
Cotton's crop grew. Larger crops in every Delta state lifted the yield from 776 to 790 pounds an acre and the crop from 13.20 to 13.44 million bales6. With exports unchanged, ending stocks rose 6% to 3.80 million bales, 27.5% of the year's use against 26.1% a month earlier1. ICE December cotton still closed 0.60 cent higher, at 80.54 cents a pound.
USDA's own price forecasts followed its stocks. It lowered the price US farmers should receive on average over the season by 10 cents, to $4.70 a bushel for corn and $6.30 for wheat, "on increased stocks" in wheat's case, and by 1 cent to 77 cents a pound for cotton1. Those forecasts draw on futures prices, so they do not stand apart from the market.
Research measures how fast futures take in the report. Over 1985-2006, corn futures moved far more on report days than on other days7. In electronic trading over 2009-2012, the reaction in corn lasted about ten minutes, with no sign of prices over- or undershooting8; across CBOT grains it fades within minutes2. In cotton, the report ranks among the market's most important sources of information9. These studies measure the size and speed of the reaction, not its direction on the days after.
Our analysis with AlphaGen
AlphaGen builds for each product a strategy that goes long or short each day from the variables it is given, recalibrates it on past data only, and measures what the strategy would have gained or lost. Each position uses only data known the session before, so every result from 2011 comes from data the model had not seen. The Sharpe ratio scores each strategy as its annual gain relative to the risk taken: positive, it made money; negative, it lost.
Our model of CBOT corn reads one line of USDA's report, US corn exports, among its sixteen variables. AlphaGen tested each line alone in two forms: the figure as printed, and its change from one report to the next. On corn exports, AlphaGen's strategy on the changes scored a Sharpe ratio of 0.76 from January 2011 to 9 October 2026, 0.88 over 2011-2018 and 0.63 over 2019-2026. The strategy on the printed figure scored 0.56, higher over 2019-2026 (0.78) than over 2011-2018 (0.35). Both were long on 8 October and stayed so on 9 October.
None of our models reads US corn ending stocks. AlphaGen's strategy on their changes from one report to the next scored 0.07 from January 2011. That result rests on 2020: without it, the strategy lost money. It lost over 2011-2018 (−0.36) and made money over 2019-2026 (0.50). October's rise in stocks turned it from long to short.
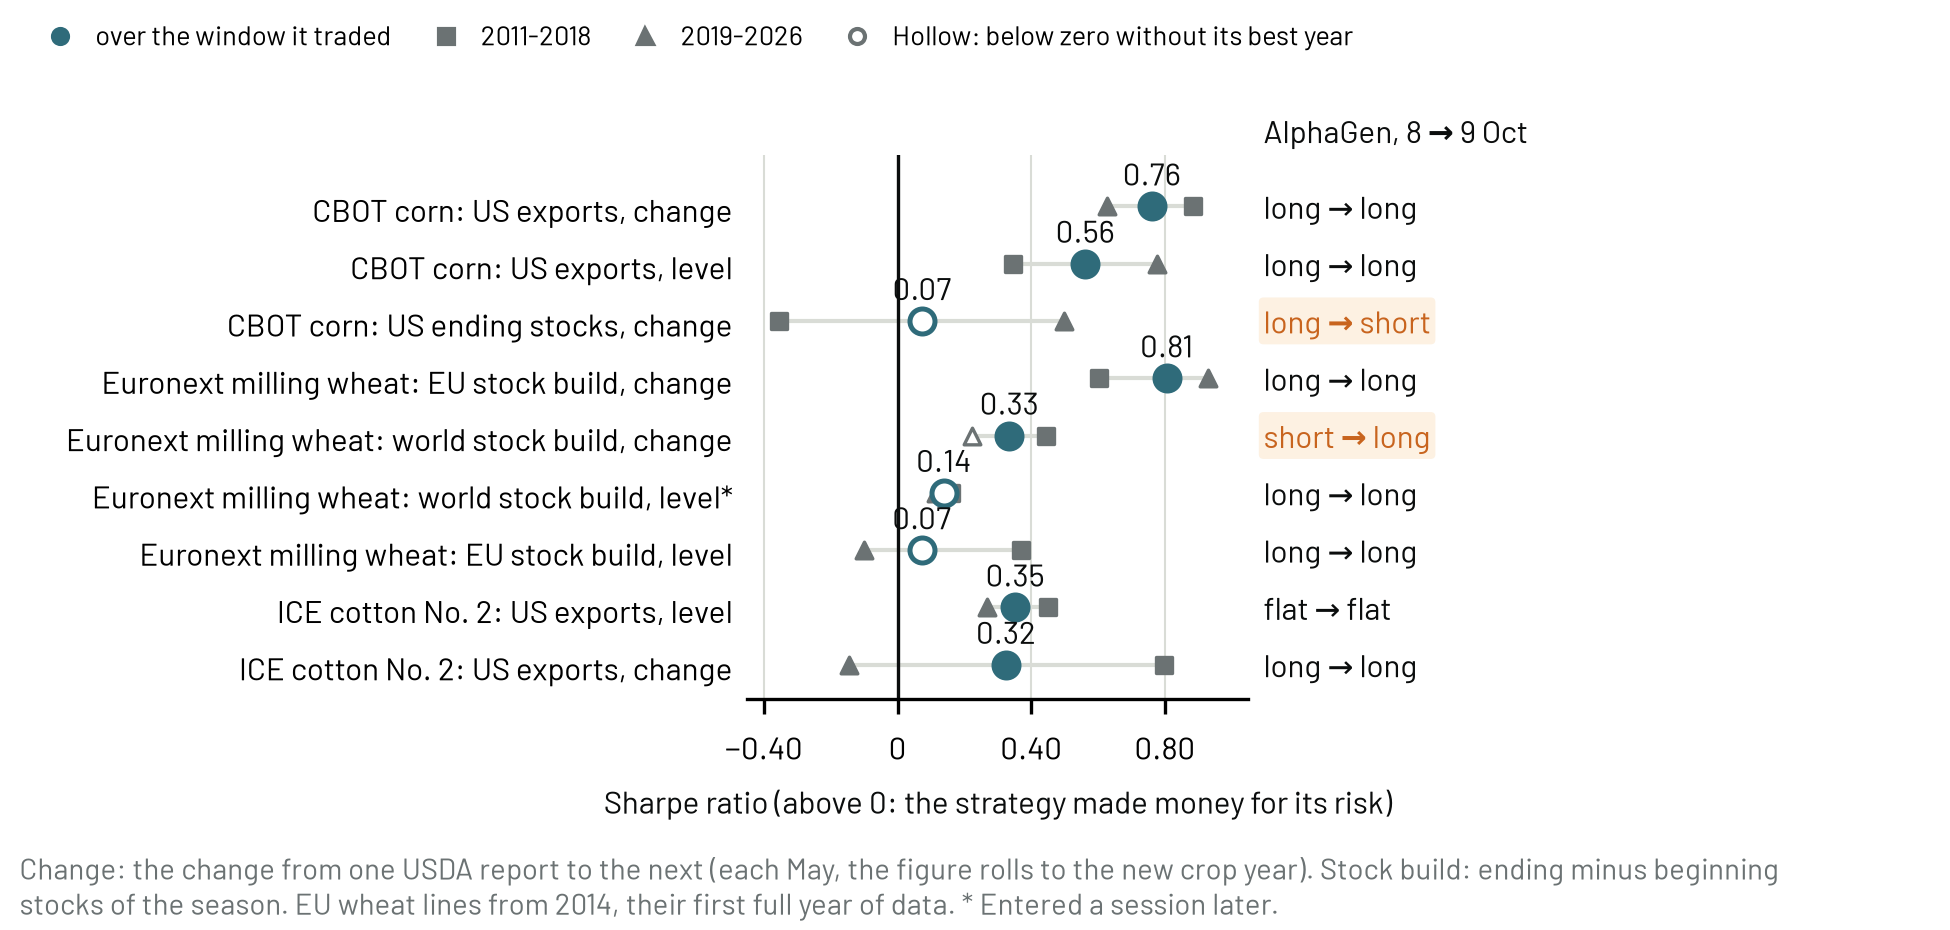
Sharpe ratio of AlphaGen's strategy on each USDA line alone, out of sample, from 2011 (EU lines from 2014) to 9 October 2026; right, its position on 8 and 9 October, the two changes highlighted. Above 0 the strategy made money for its risk, below 0 it lost; hollow: below zero without its best year. Sources: USDA, CME Group, Euronext, ICE Futures U.S. Last observation: 9 October 2026.
Our model of Euronext milling wheat reads two of the report's lines among its eleven variables: how much world and European Union wheat stocks grow or shrink over the season. AlphaGen's strategy on changes in the world figure scored 0.33 from January 2011, and USDA's forecast of a larger fall in world stocks turned it from short to long. The one on the world figure as printed entered a session later and scored 0.14 and stayed long. That result rests on 2021: without it, the strategy lost money. We gave the EU figure the world line's storage logic, with no source of its own: a larger stock build, a lower price. Its strategy on changes in that figure scored 0.81 from May 2014, when it began trading. The one on the EU figure as printed scored 0.07 and lost over 2019-2026 (−0.10). That result rests on 2015: without it, the strategy lost money. Both EU strategies stayed long.
Cotton's October balance grew, with a bigger crop and higher ending stocks, while USDA left US exports unchanged. Two of our cotton models read US exports, both to trade the gap between two delivery months rather than the price itself; AlphaGen tested the line on the price. ICE December cotton still rose 0.60 cent on 9 October. AlphaGen's positions on the export line did not change: its strategy on the printed figure held none on either day, and the one on changes stayed long. Tested alone, that strategy made money over 2011-2018 (0.80) and lost over 2019-2026 (−0.15).
Each strategy takes its position at a close and holds it for the next session. So the test measures what a USDA line told a trader from the close of its release day onwards. The minutes after release, where the research finds most of the reaction, fall outside it, and so do our models' full positions, which weigh many variables together.
What it means
Corn: AlphaGen's strategy on USDA's export changes, corn's steadiest record since 2011, stayed long December corn through Friday's fall. Wheat: its strategies on the EU and world stock builds were long Paris December wheat at Friday's close, the one on world changes since USDA forecast a larger fall in world stocks that day. Cotton: nothing changed. These are records, not calls; USDA's 10 November report is the next test.
On 10 November, a cut to US corn exports, or higher wheat stocks than USDA now expects in the EU or the world, would read the other way.
How we know
Each USDA figure enters on the day of its release: the report comes out at 12:00 New York time, before the closes of CBOT and ICE and 30 minutes before Euronext's, at 18:30 Paris time. The position is taken at each close for the next session. One line, world wheat stocks as a level, enters a session later, after failing a check at release-day timing.
Each sign was set before any run: larger stocks, a lower price, as USDA reasons; more exports, a higher price. The printed level of corn stocks was left out: its positions repeated corn's own recent moves. AlphaGen's strategies on changes in US corn exports and in the EU stock build still made money without their best year (0.63 and 0.66) and without the May reports, when USDA's figures roll to a new crop year (0.80 and 0.80). Each result is one observed run.
How this issue was built
Improm Atlas gathered the market record, and AlphaGen measured, on data it had not seen, how well each indicator anticipated each market. Talk to us about testing your own indicators.
atlas.improm.ai · alphagen.improm.ai · improm.ai
Note — Not investment advice.
Footnotes
-
USDA, World Agricultural Outlook Board, 9 October 2026. World Agricultural Supply and Demand Estimates, WASDE-676wasde1026.pdf ↩ ↩2 ↩3 ↩4 ↩5
-
Adjemian and Irwin, American Journal of Agricultural Economics 100(4), 2018. USDA Announcement Effects in Real-Time ↩ ↩2
-
WASDE: World Agricultural Supply and Demand Estimates, USDA's monthly forecast of supply and use for each crop, in the United States and the world. ↩
-
Ending stocks: the grain left when the marketing year ends, after the crop, imports and the stocks carried in have met the year's use. ↩
-
Euronext, 9 October 2026. Milling Wheat (EBM), prices, 8 and 9 October 2026 ↩
-
Bale: the US cotton trade's unit, 480 pounds of lint. ↩
-
Isengildina-Massa, Irwin, Good and Gomez, Journal of Agricultural and Applied Economics 40(1), 2008. The Impact of Situation and Outlook Information in Corn and Soybean Futures Markets: Evidence from WASDE Reports ↩
-
Lehecka, Wang and Garcia, Applied Economic Perspectives and Policy 36(3), 2014. Gone in Ten Minutes: Intraday Evidence of Announcement Effects in the Electronic Corn Futures Market ↩
-
Xie, Isengildina-Massa, Dwyer and Sharp, Applied Economics 48(36), 2016. The impact of public and semi-public information on cotton futures market ↩
Get the next one by email
Research notes on commodities signals — what we tested, what worked, and what did not.
Continue reading
Tanker rates: a window into global oil market disruptions
· 10 min
Should cocoa traders follow El Niño?
· 7 min
The best way to trade the oil shock is a sugar contract
· 3 min
Test your own variable on your own data
AlphaGen runs the statistical battery, the calibration and the risk-managed backtest for you — in minutes, not weeks.