Should Brent buyers follow the geopolitical risk index?
Attacks near Hormuz took Brent to $109.86 on 16 October. On its own, the geopolitical risk index's weekly change would have helped a Brent trader since 2018. Added to our Brent model, which already reads the VIX, equities and the dollar, it did not improve it.
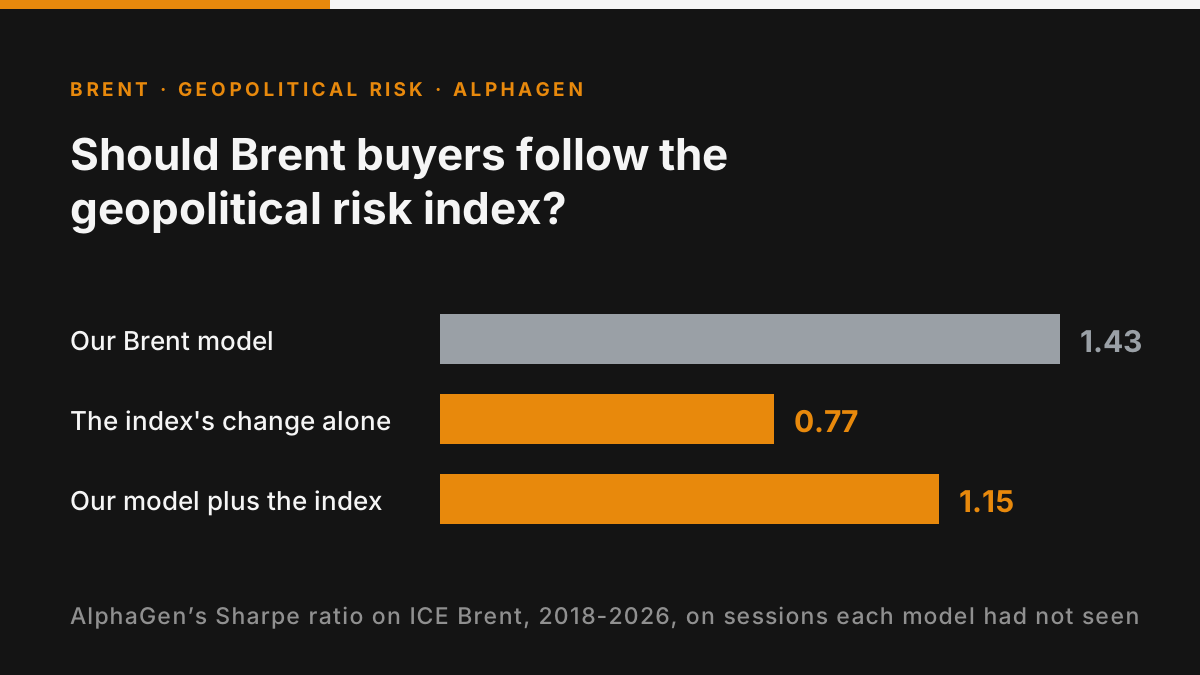
Attacks near Hormuz took Brent to $109.86 on 16 October. On its own, the geopolitical risk index's weekly change would have helped a Brent trader since 2018. Added to our Brent model, which already reads the VIX, equities and the dollar, it did not improve it.
ICE Brent December settled at $109.86 a barrel on Friday 16 October, $3.94 higher on the day1, after a week of attacks on ships in and near the Strait of Hormuz2. Analysts at ING said the attacks had the market "pricing in a significant risk premium"3: the part of the price paid for the risk of losing barrels, before any are lost. Dario Caldara and Matteo Iacoviello measure that risk with an index built from articles in ten newspapers4. AlphaGen, our modelling tool, measured what the index told a Brent trader about the next session, alone and inside our own model of Brent.
The essentials
- Brent December gained $5.14 a barrel in the week to 16 October, and June 2027 $4.15, about four-fifths as much.
- Research finds tension involving China, Israel, Russia or Venezuela lifted Brent at once, while a rise in the global index came with a lower price a quarter later.
- Our Brent model scored a Sharpe ratio of 1.43 over 2018-2026. Alone, a strategy on the index's weekly change scored 0.77; with the index added, our model scored 1.15.
- The index's release of 13 October, covering 5-11 October, fell to 158 from 184. The next, on 19 October, covers 12-18 October.
A week of attacks, and what the research says
Through the week, Iran stepped up its attacks on ships in and near the Strait of Hormuz, the channel for Gulf crude2. Brent December settled5 at $109.86 a barrel on Friday, 4.9% above its settlement of $104.72 on 9 October6, having touched $110 in the session, CNBC reported. WTI November, the US benchmark, settled at $101.411.
The rise carried down the curve. June 2027 gained $4.15, about four-fifths of December's rise, and January $5.57, more than December. December's lead over June went from $13.25 to $14.24 a barrel, a backwardation7 (chart below).
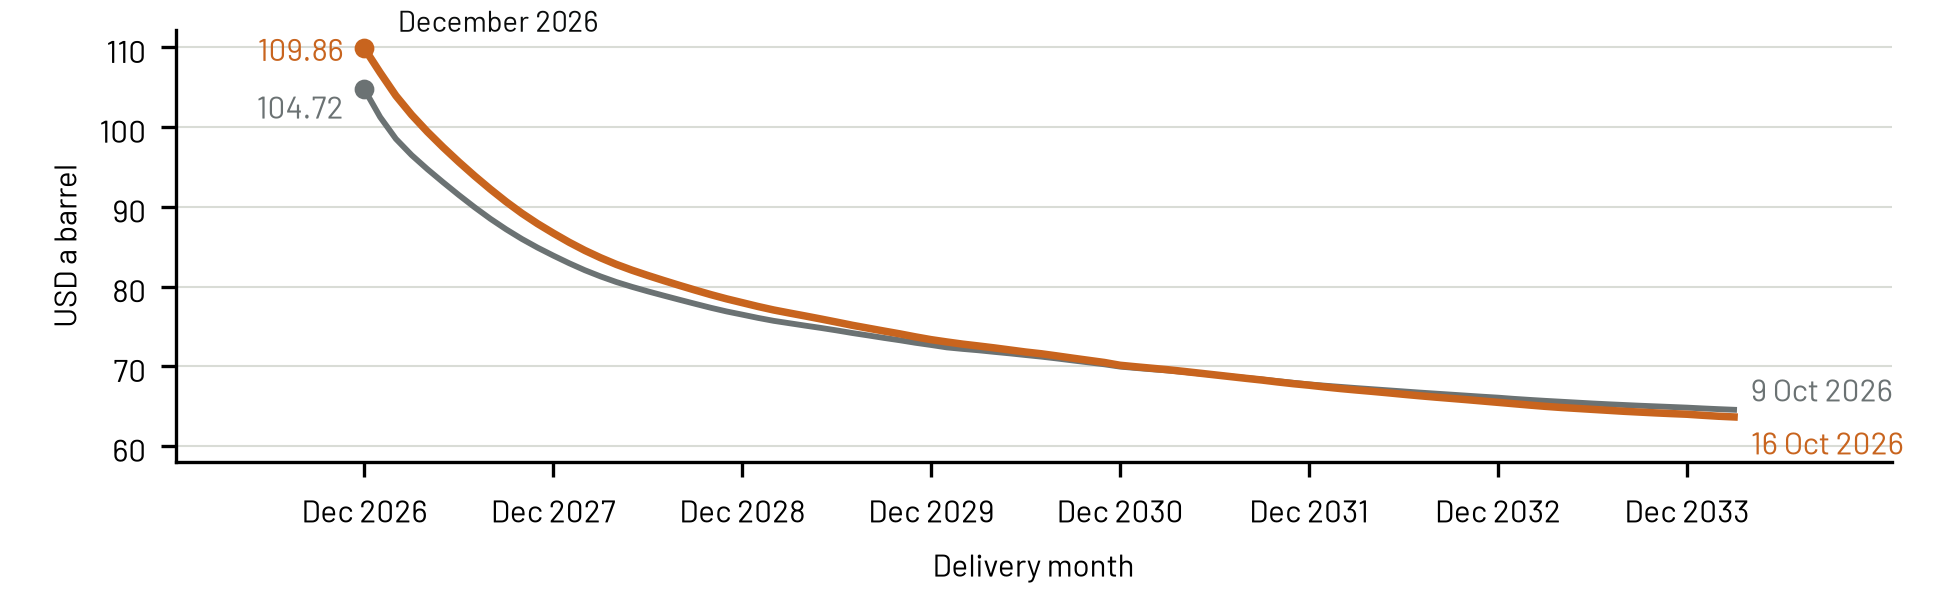
ICE Brent futures by delivery month, USD a barrel, closes on 9 and 16 October 2026 (equal to settlements where checked). Source: ICE Futures Europe. Last observation: 16 October 2026.
Governments are adding barrels. On 15 October OilPrice reported that the International Energy Agency's members had released about 330 million barrels of emergency stocks since their action in March, and still had roughly 100 million to deliver; total releases are set to exceed the 400 million pledged in March, with more than 20 million barrels of diesel to go out as soon as possible8.
Research gives geopolitical risk two opposite routes to the oil price. Fear of losing supply makes refiners and traders buy ahead of need, Lutz Kilian's precautionary demand, which over 1973-2005 lifted the real oil price at once and for long9; he measured it from oil-market data, not a news index.
Studies of the index find both routes. In a monthly model of Brent over 2000-2023, European Central Bank (ECB) economists found that tension involving China, Israel, Russia or Venezuela lifted Brent at once, by between 0.8% and 1.5%; most of those effects faded after a quarter, while Russia's stayed near 2%. A rise in the global index had no effect they could tell from zero at first, and left Brent about 1.2% lower a quarter later10. On monthly WTI over 1985-2017, Plakandaras, Gupta and Wong report a negative link to oil returns11. Abdel-Latif, El-Gamal and Jaffe found oil prices leading the index by about two months the years from the end of the Arab Spring to 2019, on horizons of months to years12.
What Brent did after past jumps in the index
The index's last release before the cut, on 13 October, covered 5-11 October, a week in which CNBC reported five more tankers attacked by 9 October13. Its weekly average fell to 158 from 184.
Since 2010, the index's weekly rise has been among the largest in its history to that date sixty times. Brent's front month stood higher one week later after half of them, against 53% of all weeks, and four weeks later after twenty-nine, about half, against 56% of all weeks; the threats component gives the same picture. Two-thirds of the jumps (39 of 60) came with Brent in backwardation; the curve's state made no difference we could establish to Brent four weeks on.
Our analysis with AlphaGen
AlphaGen, our modelling tool, builds for each product a strategy that goes long or short each day from the inputs it is given, recalibrates it on past data only, and measures what it would have gained or lost from 2018, on data the model had not seen. Each input enters on the date it carries, the index a session after its Monday release and a few others later still, as How we know says, and every gain printed here kept at least half its size with each position held a session later. The Sharpe ratio scores each strategy as its annual gain relative to the risk taken: positive, it made money; negative, it lost. Our Brent model, the one we run every day, scored 1.43 over 2018-2026.
The first test took the index alone, with the positive sign Kilian's precautionary demand gives it, in four measures: the full index and its threats component14, each as a weekly average and as its change over a week. Over 2018-2026, the strategy on the full index's weekly change made money, with a Sharpe ratio of 0.77, and in both halves: 0.92 over 2018-2021 and 0.62 over 2022-2026. Without its best year, 2021, it still scored 0.60. The other three lost money: −0.10 on the full index's weekly average, and −0.23 and −0.15 on the threats average and weekly change, read a session later.
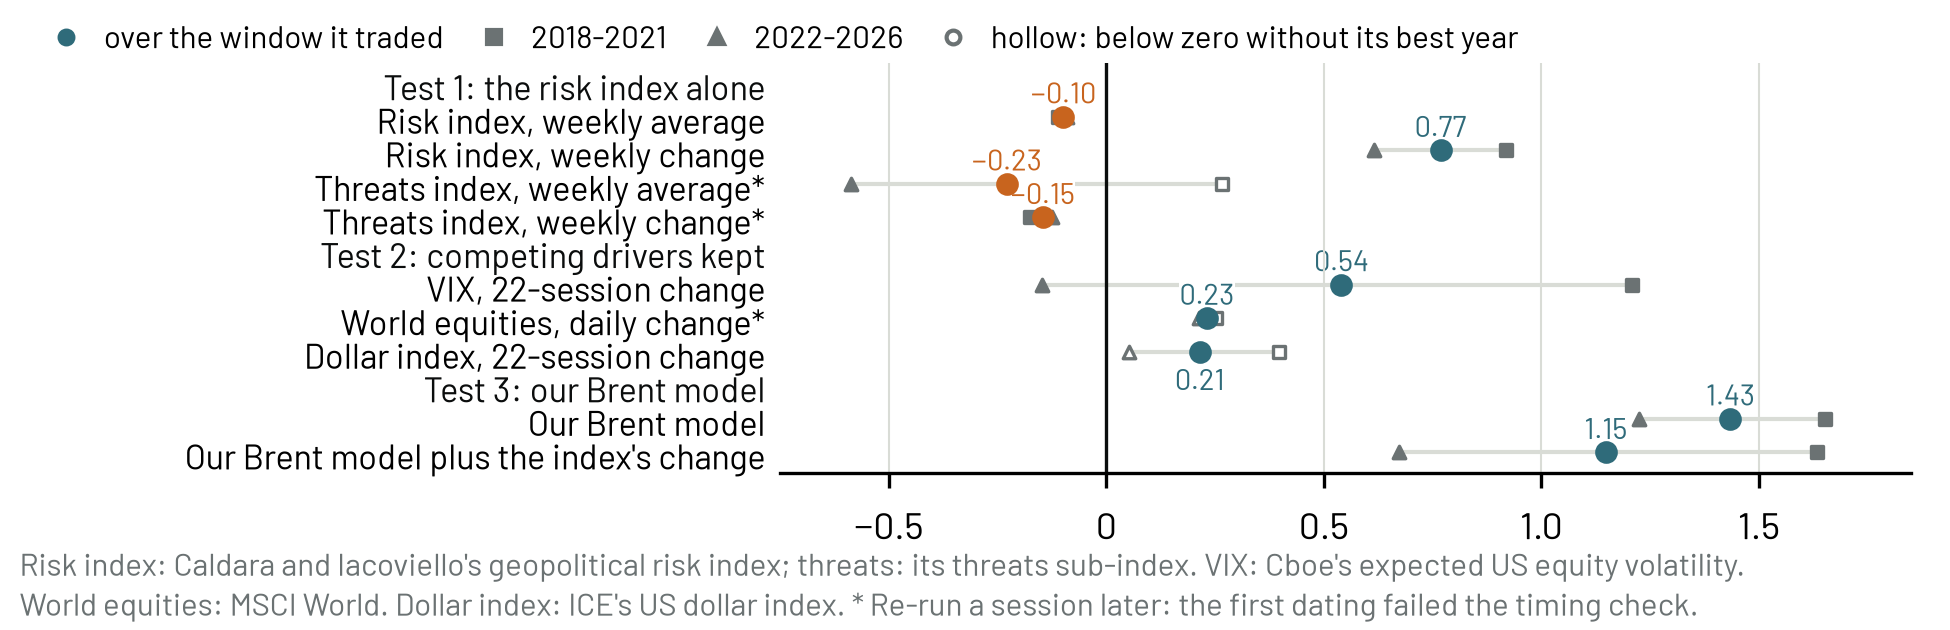
Sharpe ratio of AlphaGen's strategy on each input, on ICE Brent, out of sample from 2018 to 16 October 2026. Sources: Caldara and Iacoviello, ICE Futures Europe, Cboe, MSCI, ICE Futures U.S. Last observation: 16 October 2026.
The second test calibrated Brent's competing drivers, each alone. Of five drivers with a published mechanism, three are shown, picked because their strategies made money over 2018-2026. On the VIX's change over 22 sessions, about a month, a gauge of risk aversion whose rise lowers oil, the strategy scored 0.54, gaining over 2018-2021 (1.21) and losing over 2022-2026 (−0.15). World equities' daily change, a gauge of activity and so of oil demand, read a session later, scored 0.23, and the dollar index's change over the same 22 sessions, whose fall lifts oil's dollar price, 0.21. Each of those two gains came from one year: 2022 for equities, 2018 for the dollar.
The third test added the index's weekly change to our Brent model, whose seventeen inputs, recalibrated every ten sessions, already include the VIX, world equities, the dollar and a measure drawn from the index: the weekly change in how much it varied over the past year. With the index, the model scored 1.15 over 2018-2026: about the same over 2018-2021 (1.65 and 1.63), lower over 2022-2026 (1.22 and 0.67), and higher than without it in only two years of nine. Next to the model's own inputs, the index brought nothing more. With every input entered a session later, the index changed the model's score by only +0.09. Adding an input reweights the others, so the change is not the index's alone. The tests cover Brent's next session, not the effect a quarter later that the ECB found.
What it means
For a desk whose model already reads the VIX, equities and the dollar, as ours does, the index is a barometer, not an edge. Its jumps gave no direction a month out: after 60 past jumps, Brent was higher four weeks later only about half the time. A buyer covering 2027 already pays most of the week's rise: June 2027 rose four-fifths as much as December. To follow: the index each Monday and the IEA's roughly 100 million barrels left to deliver.
How we know
The index is built from articles in ten newspapers15; its daily values come out each Monday, and AlphaGen used each value from the session after its release. World equities and the threats measures entered a session later still: at the usual dating, their results failed a timing check.
AlphaGen's second test: drivers picked from inputs already tested, for their mechanism and for how they did, then recalibrated alone.
How this issue was built
Improm Atlas gathered the market record, and AlphaGen measured, on data it had not seen, how well each indicator anticipated each market. Talk to us about testing your own indicators.
atlas.improm.ai · alphagen.improm.ai · improm.ai
Note — Not investment advice.
Footnotes
-
Xinhua (via The Star), 17 October 2026. Crude futures settle higher ↩ ↩2
-
CNBC, 16 October 2026. Brent oil touches $110 as Iran escalates Hormuz attacks, Ukraine vows to hit Russian refineries ↩ ↩2
-
OilPrice, quoting ING, 16 October 2026. Oil Prices Head for Weekly Gain as Hormuz Attacks Rattle Markets ↩
-
Caldara and Iacoviello, American Economic Review 112(4), 2022. Measuring Geopolitical Risk ↩
-
Settlement: the exchange's official end-of-day price for a contract, used to value open positions; it can differ from the last trade. ↩
-
Xinhua (via The Star), 10 October 2026. Crude futures settle higher ↩
-
Backwardation: nearby delivery months priced above later ones, oil now worth more than oil later. ↩
-
OilPrice, 15 October 2026. IEA Speeds Emergency Oil Release ↩
-
Kilian, American Economic Review 99(3), 2009. Not All Oil Price Shocks Are Alike: Disentangling Demand and Supply Shocks in the Crude Oil Market ↩
-
Ferrari Minesso, Lappe and Rößler, ECB Economic Bulletin 8/2023, box, 2023. Geopolitical risk and oil prices ↩
-
Plakandaras, Gupta and Wong, Resources Policy, 2019. Point and Density Forecasts of Oil Returns: The Role of Geopolitical RisksPlakandaras_Point_2018.pdf ↩
-
Abdel-Latif, El-Gamal and Jaffe, Economics of Energy & Environmental Policy 9(2), 2020. The Ephemeral Brent Geopolitical Risk Premium ↩
-
CNBC, 9 October 2026. Tanker attacks in Strait of Hormuz surge to wartime high as Iran tries to choke off oil exports ↩
-
Threats index: the part of the index that counts articles on threats of war, terror or military build-up, as against acts. ↩
-
Matteo Iacoviello, October 2026. Geopolitical Risk (GPR) Index ↩
Get the next one by email
Research notes on commodities signals — what we tested, what worked, and what did not.
Continue reading
Tanker rates: a window into global oil market disruptions
· 10 min
What USDA's October report changed in the figures our models read
· 9 min
Should cocoa traders follow El Niño?
· 7 min
Test your own variable on your own data
AlphaGen runs the statistical battery, the calibration and the risk-managed backtest for you — in minutes, not weeks.